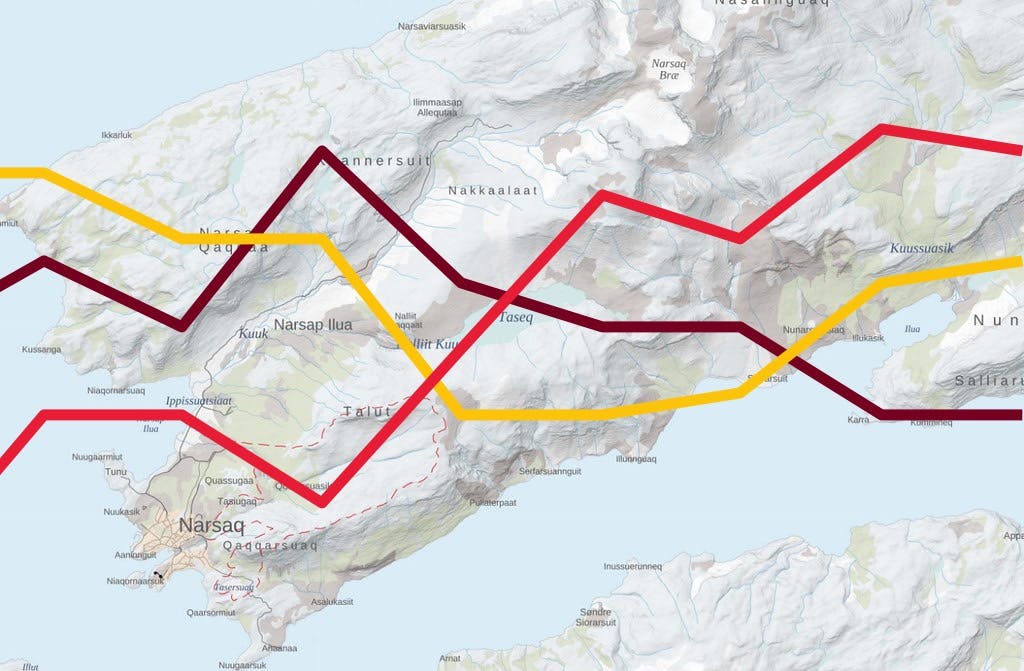
SDG indicators are visualized on maps
In the future, NunaGIS will show SDG indicators on maps so that it will be possible to see regional development differences.
As part of the work to implement the SDG 2030 agenda and follow-up on SDG indicators, an SDG page is now being developed on NunaGIS to display indicators at the regional level. In this way, NunaGIS gets an interaction with the new site Anguniakkavut. Where Anguniakkavaut shows SDG statistics at a national country level, NunaGIS will show SDG indicators at a more detailed local, geographical level.
In the future, NunaGIS will be able to see regional differences in a number of SDG indicators between, for example, the Greenlandic municipalities on a map. By dividing the statistical basis for the individual SDG 2030 indicators at a geographical level, a more targeted effort and knowledge sharing within Greenland is made possible. And when statistical data is visualized on maps, it is often easier to get an overview and follow developments.
Department of National Planning by e-mail: landsplan@nanoq.gl
